

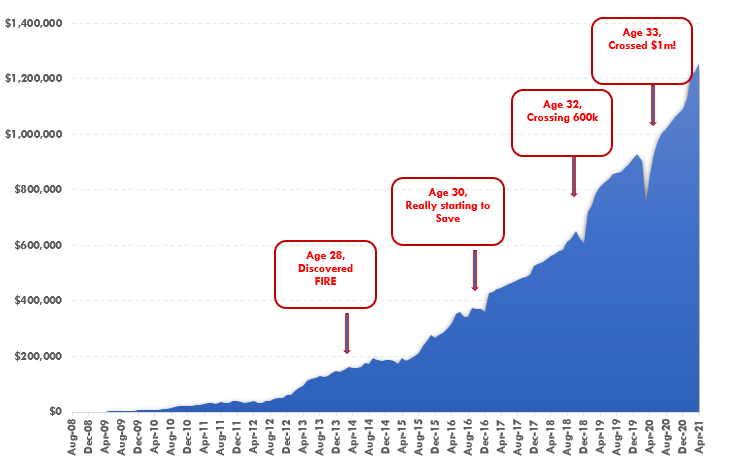
In recent times, I’ve achieved financial independence and have retired early. This new age phenomenon is known as the FIRE movement and it’s taken the millennial and Gen Z demographics by storm. I’ve written about just how I achieved financial independence in this post. As well, I’ve written about how I travelled the world for a year and my net worth increased, thereby validating that the premise behind FIRE actually works.
In this post, I will write about my portfolio in detail and just what is in my portfolio of stocks. My portfolio has changed over the years but generally, I’ve kept the same handful of ETFs consistently. I will buy and sell single name stocks throughout the year depending on what I find interesting as far as investment opportunities goes.
I try to keep my single name stock exposure relatively low so when I do take a loss, it doesn’t impact me in any significant manner.
I won’t talk about my single name stock purchases throughout the year but rather just the ETFs that I’m holding consistently. These are the ETFs that I purchased with my salary every month during my “accumulation phase”.
As I’ve already achieved financial independence, I regularly withdraw from my portfolio of stocks enough to live the life I want. This is something between $30k and $50k a year. I also make sure I pay 0% in income taxes by taking advantage of the long term capital gains rate.
Note that the figures for everything in this post are from December 2021. Obviously stock prices will change and percentages will also differ as the years pass by!
My Portfolio Split out
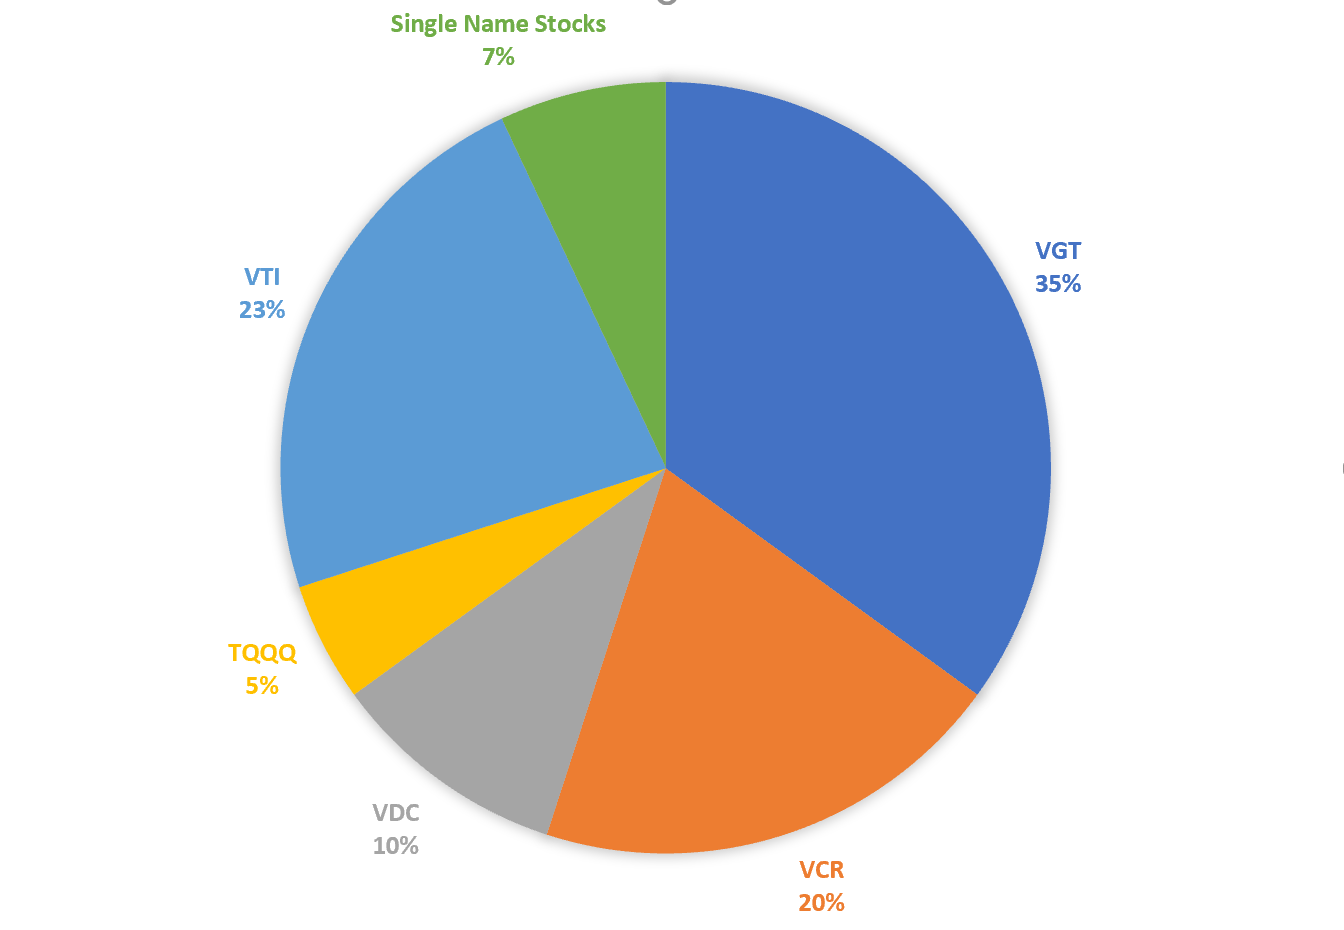
Below is a split of my portfolio based on the ETFs I own. I will go into detail about every one of these ETFs in the rest of the post. Specifically, why I own these ETFs, what stocks are in them, and their price movements over the last few years.
Vanguard Information Technology (VGT)
Without a doubt, my biggest holdings in my portfolio has to be Vanguard’s Information Technology fund. I hold roughly 1/3 of my entire portfolio in this ETF.
Vanguard Information Technology is Vanguard’s premier tech ETF. Its portfolio consists of the largest names out there like Apple, Microsoft, and NVidia. I have always been a fan of Vanguard’s ETFs because of their low management fees (VGT only has 0.1%) and Vanguard’s tech ETF has done really well.
VGT vs QQQ
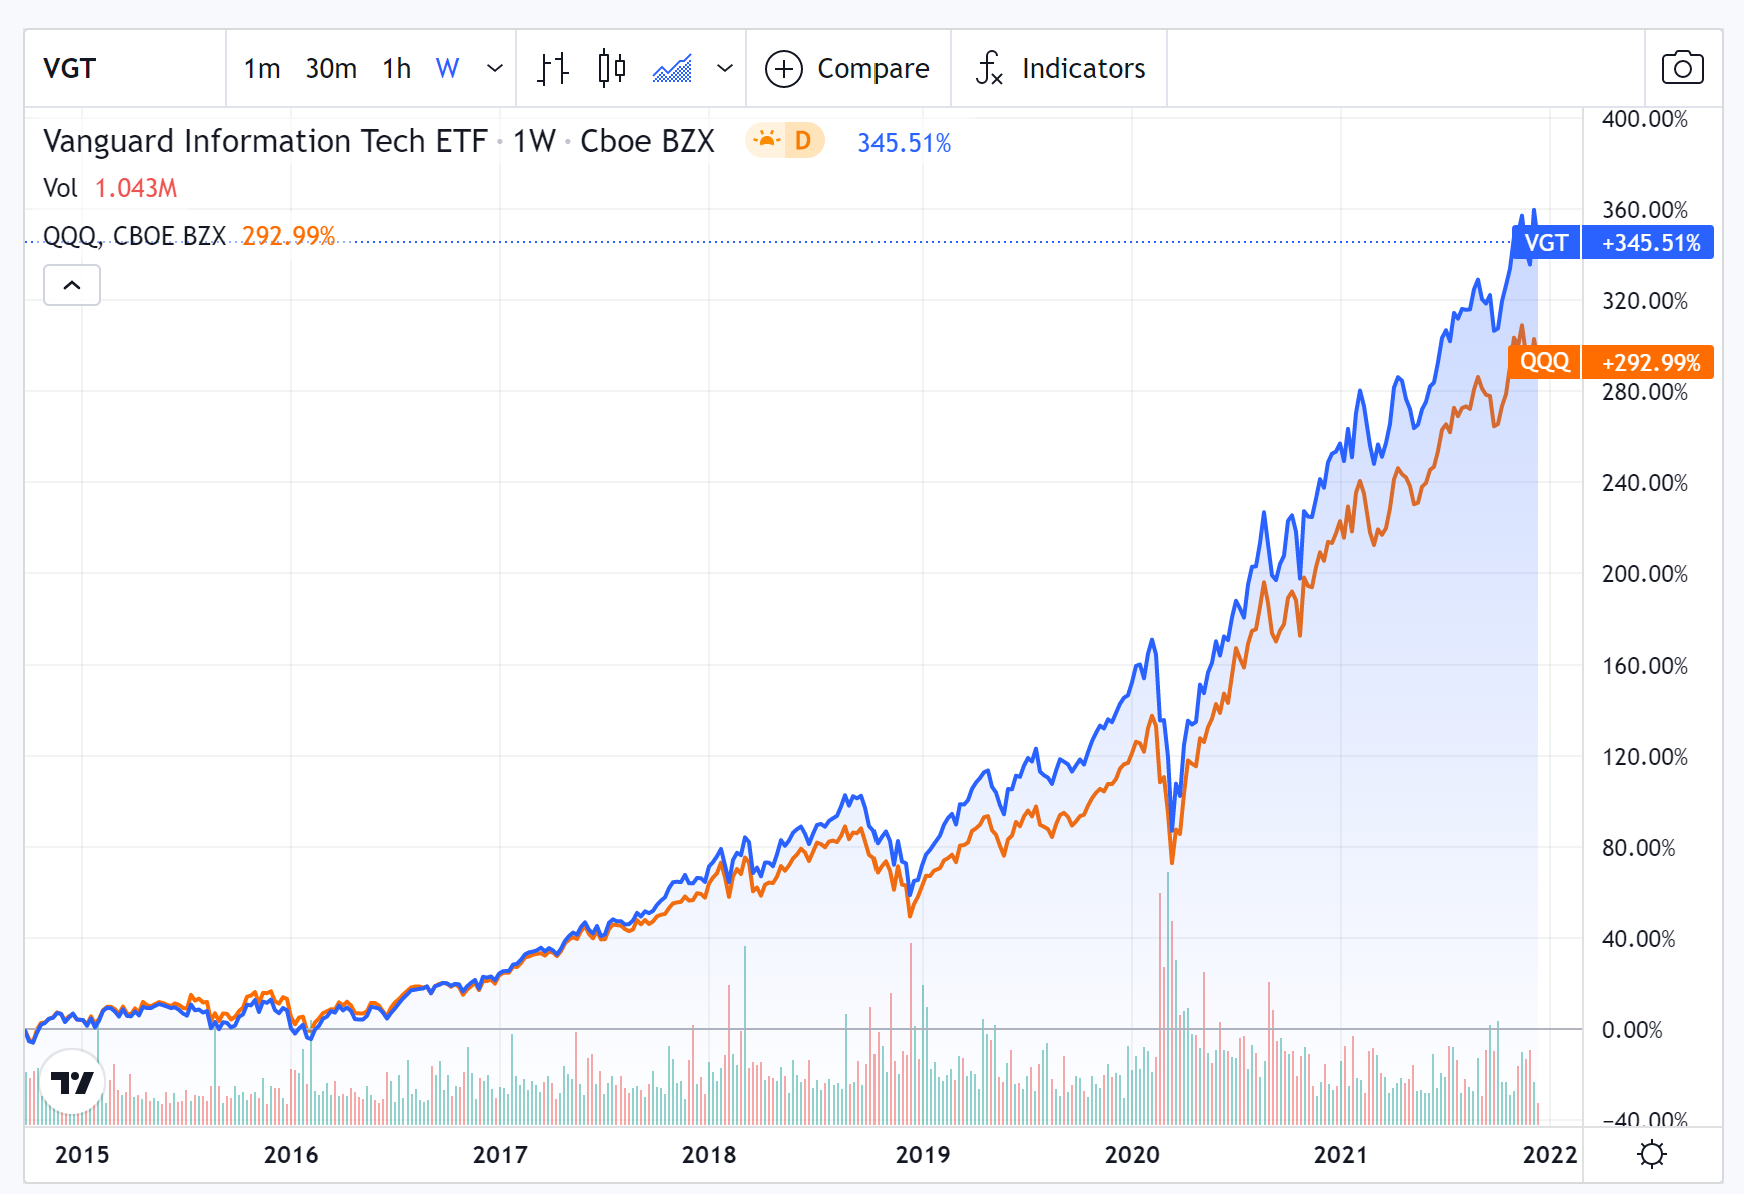
VGT has outperformed the much more popular and liquid Powershares QQQ ETF over the years. I think this has to do with the extra allocation towards Apple and NVDA for VGT. I’ve stayed strong with Vanguard’s ETF over the years and it’s paid off to the tune of almost 50%! I will keep this allocation going forward.
Price history of VGT
VGT Portfolio Top 15 Holdings
Symbol | Holding | % Assets |
|---|---|---|
| AAPL | Apple Inc. | 19.35% |
| MSFT | Microsoft Corporation | 18.36% |
| NVDA | NVIDIA Corporation | 4.93% |
| V | Visa Inc. Class A | 2.60% |
| ADBE | Adobe Inc. | 2.41% |
| MA | Mastercard Incorporated Class A | 2.30% |
| CRM | salesforce.com, inc. | 2.25% |
| PYPL | PayPal Holdings, Inc. | 2.01% |
| CSCO | Cisco Systems, Inc. | 1.83% |
| ACN | Accenture Plc Class A | 1.77% |
| AVGO | Broadcom Inc. | 1.68% |
| INTC | Intel Corporation | 1.53% |
| ORCL | Oracle Corporation | 1.39% |
| TXN | Texas Instruments Incorporated | 1.34% |
| INTU | Intuit Inc. | 1.32% |
Vanguard Total Stock Market Index (VTI)
The next big ETF in my portfolio is Vanguard’s Total Stock Market Index (VTI). This ETF is a broad exposure to the entire US stock market, investing in thousands of different companies. As you can see from the top 15 holdings below, the biggest names are of course the tech companies because they are the biggest companies in the world. However, the percentages are much lower than those in VGT. You’ll see there are exposures to banks, utilities, healthcare, energy, manufacturing etc. Everything is in VTI.
VTI is the ultimate diversification tool of portfolios. Buying VTI is equivalent to just “buying the market”. The correlation between VTI and the overall S&P 500 is quite high which means when the market goes up, your portfolio goes up and vice versa.
VTI also has one of the lowest management fees available. At 0.03%, this fee is pretty much negligible. At the crux of the FIRE ethos, it’s actually recommended to just own 100% of VTI. The whole premise of FIRE and withdrawal rates is based on just owning the broad market. VTI is exactly what the broad market is. However, as much as I like to keep things simple, I am totally comfortable with my exposure to Tech, even if I am bucking the trend against the FIRE community!
Price history of VTI
VTI Portfolio Top 15 Holdings
Symbol | Holding | % Assets |
|---|---|---|
| MSFT | Microsoft Corporation | 5.24% |
| AAPL | Apple Inc. | 4.95% |
| AMZN | Amazon.com, Inc. | 3.05% |
| GOOGL | Alphabet Inc. Class A | 1.88% |
| TSLA | Tesla Inc | 1.88% |
| GOOG | Alphabet Inc. Class C | 1.69% |
| FB | Meta Platforms Inc. Class A | 1.62% |
| NVDA | NVIDIA Corporation | 1.28% |
| JPM | JPMorgan Chase & Co. | 1.07% |
| BRK.B | Berkshire Hathaway Inc. Class B | 1.04% |
| UNH | UnitedHealth Group Incorporated | 0.91% |
| JNJ | Johnson & Johnson | 0.90% |
| HD | Home Depot, Inc. | 0.82% |
| BAC | Bank of America Corp | 0.76% |
| V | Visa Inc. Class A | 0.75% |
Vanguard Consumer Discretionary (VCR)
Vanguard Consumer Discretionary (VCR) is another ETF that I have a significant amount of money in. Consumer discretionary has seen a big boost in recent years because of its exposure to Amazon and Tesla. It also has big names like Nike, Home Depot, Target, and Starbucks that I like to hold.
I think Amazon has completely changed the way we live our lives and the stock price appreciation over the past decade has of course shown this. In fact, I think the failure of many retail businesses (small to large) over the past decade can be directly attributed to Amazon. For better or for worse, the value was directly or indirectly transferred to Amazon’s market cap.
Price history of VCR
VCR Portfolio Top 15 Holdings
Symbol | Holding | % Assets |
|---|---|---|
| AMZN | Amazon.com, Inc. | 21.48% |
| TSLA | Tesla Inc | 14.27% |
| HD | Home Depot, Inc. | 6.63% |
| NKE | NIKE, Inc. Class B | 3.54% |
| MCD | McDonald\’s Corporation | 3.09% |
| LOW | Lowe\’s Companies, Inc. | 2.79% |
| TGT | Target Corporation | 2.17% |
| SBUX | Starbucks Corporation | 2.11% |
| BKNG | Booking Holdings Inc. | 1.69% |
| TJX | TJX Companies Inc | 1.34% |
| GM | General Motors Company | 1.21% |
| F | Ford Motor Company | 1.15% |
| MELI | MercadoLibre, Inc. | 1.13% |
| LULU | Lululemon Athletica Inc | 1.00% |
| DG | Dollar General Corporation | 0.90% |
Vanguard Consumer Staples (VDC)
Vanguard Consumer Staples (VDC) provides exposure to the consumer staples sector of the markets. The consumer staples market focuses on tried and true products and companies that have consistently generated profits over a long time horizon.
Consumer staples are companies like Procter and Gamble, Coke, Pepsi, Philip Morris, General Mills, Walmart etc. These are companies that have been around for a long time and are no longer “growth stocks”. This means, they’ve found their market and niche and just focus on producing specific products that are always in demand by consumers. Companies like this generally pay higher dividends because they have no need to reinvest their profits into their businesses, and are better served by just giving the profits back to shareholders. VDC performs well in inflationary and rising rate environments, which is generally the opposite of growth/tech stocks.
VDC has a dividend yield of 2.5% which is higher than the broad market (like VTI).
Price History of VDC
The price growth is not going to impress anyone. It’s actually underperformed VTI so in fact, I should probably not even hold VDC. However, I don’t mind the small exposure I have to it because I feel like it is the ultimate defensive ETFs.
VDC Portfolio Top 15 Holdings
Symbol | Holding | % Assets |
|---|---|---|
| PG | Procter & Gamble Company | 13.22% |
| WMT | Walmart Inc. | 8.36% |
| KO | Coca-Cola Company | 8.35% |
| PEP | PepsiCo, Inc. | 8.01% |
| COST | Costco Wholesale Corporation | 7.70% |
| PM | Philip Morris International Inc. | 4.22% |
| MDLZ | Mondelez International, Inc. Class A | 3.68% |
| MO | Altria Group Inc | 3.40% |
| EL | Estee Lauder Companies Inc. Class A | 3.14% |
| CL | Colgate-Palmolive Company | 2.67% |
| KMB | Kimberly-Clark Corporation | 1.95% |
| SYY | Sysco Corporation | 1.69% |
| ADM | Archer-Daniels-Midland Company | 1.61% |
| GIS | General Mills, Inc. | 1.61% |
| STZ | Constellation Brands, Inc. Class A | 1.58% |
Last on the list is TQQQ, Powershares 3x leveraged ETF. This ETF is the same as QQQ, which is the most popular Nasdaq ETF on the market. QQQ has a slightly different portfolio of stocks compared with VGT but has underperformed Vanguard’s ETF over the years (just slightly).
TQQQ is PowerShares leveraged product on QQQ. It provides 3x the leverage which means that price movements are 3x that of QQQ. If QQQ rises 2% in a day, then TQQQ will rise roughly 6%. Conversely, if QQQ declines 2%, then you’re looking at a huge loss as well of 6%. However, since the Nasdaq has performed so well over the past decade, TQQQ has really crushed it. It’s returned something like 1000% since 2015.
I only bought TQQQ in the last few years so sadly I did not witness such phenomenal growth in my portfolio. I have a position in TQQQ mainly to sell covered calls against. I sell weekly covered calls on TQQQ with a very low delta (<0.15) and only when markets are near all time highs. I explain this process in my selling covered call options guide.


Hi Johnny, have you considered diversifying away from the US market? Like buying European stocks, Asian stocks or Emerging Markets stocks?
Great read!
Anther great read Johnny! Thanks for taking the time to share your portfolio and it’s why’s.