
Spreadsheets are life and using a spreadsheet for my mortgage tracking and home profit calculation is essential. I am a fan of using them for everything. I religiously use a spreadsheet to track my net worth and expenses as well as when I collect credit cards for their lucrative rewards.
I’ve always traded stocks and invested my money over the long term as a way to pursue the FIRE (Financial Independence Retire Early) lifestyle. I couldn’t find many good spreadsheet options to track the list of all my stock positions which turned out to be ever increasing.
I reached Financial Independence in 2020 which was quite the milestone for me. In the last year, I’ve traveled the world for a year and my net worth actually increased. Option selling has helped me manage my expenses and income during early retirement.
- Trading options is all a part of my net worth building regimen. I use this spreadsheet to track net worth and expenses.
- If you’re more advanced and want to trade options, I’ve also created this spreadsheet to track options trading
- Also, check out my travel itinerary planning spreadsheet which is perfect for organizing and planning your trip!
- My spreadsheet to track my stock positions using the Google Finance function.
Why use a spreadsheet for mortgage
I’m an avid user of spreadsheets in my life and there’s nothing more perfect for a spreadsheet than a mortgage. If you own a home, or are in the process of buying a home, or just want to see what a mortgage payment schedule looks like, this spreadsheet is for you.
A mortgage spreadsheet like the one I’ve created will help you visualize your entire payment schedule over the course of a 15y or 30y mortgage just so you can see exactly how much money you’re spending every month. In addition, this spreadsheet breaks down your payments by interest and principal so you can see just how fast you’re paying off your mortgage.
I used the spreadsheet a lot when I first purchased my home just so I could play around with the figures and see what I could expect as far as ROI goes when I sell my home down the line.
I don’t like real estate investing
I am not a big fan of real estate and think it totally under performs the equity markets especially if you’re putting down 20%. While of course you can make a hefty profit on your home if you buy it in the right place at the right time, I just think on average it does not outperform equities. Again keyword is on average. I’m comparing the average real estate gains in the market to something the S&P 500. I know yes you made a lot of money on your home in Seattle during the tech boom but I could have bought Tesla stock at the same time and let’s see who has a higher profit.
The problem with real estate is that the transaction costs are so high. When you purchase a place, the costs to purchase and when you sell is something like 10% (broker fees, transfer taxes, appraisals, etc.). In addition, any damage, renovations, or fixes you make have to be deducted from your final sale price to calculate the true profit. These are things you would not have to deal with in a rental apartment. Plus I’m terrible when it comes to hands on things so I would have to spend crazy amounts of money to fix up damages.
Lastly, real estate is just so illiquid. I love having my money in stocks as this money is available at any point. I can also trade options around it for extra passive income like the options wheel.
As a digital nomad who travels the world, owning real estate is also a bad investment as managing something half way across the world becomes a headache.
What does this mortgage spreadsheet calculate?
My mortgage spreadsheet does everything. It calculates the simple things like how much your monthly payments are given your mortgage amounts, down payment, interest rate, and mortgage duration.
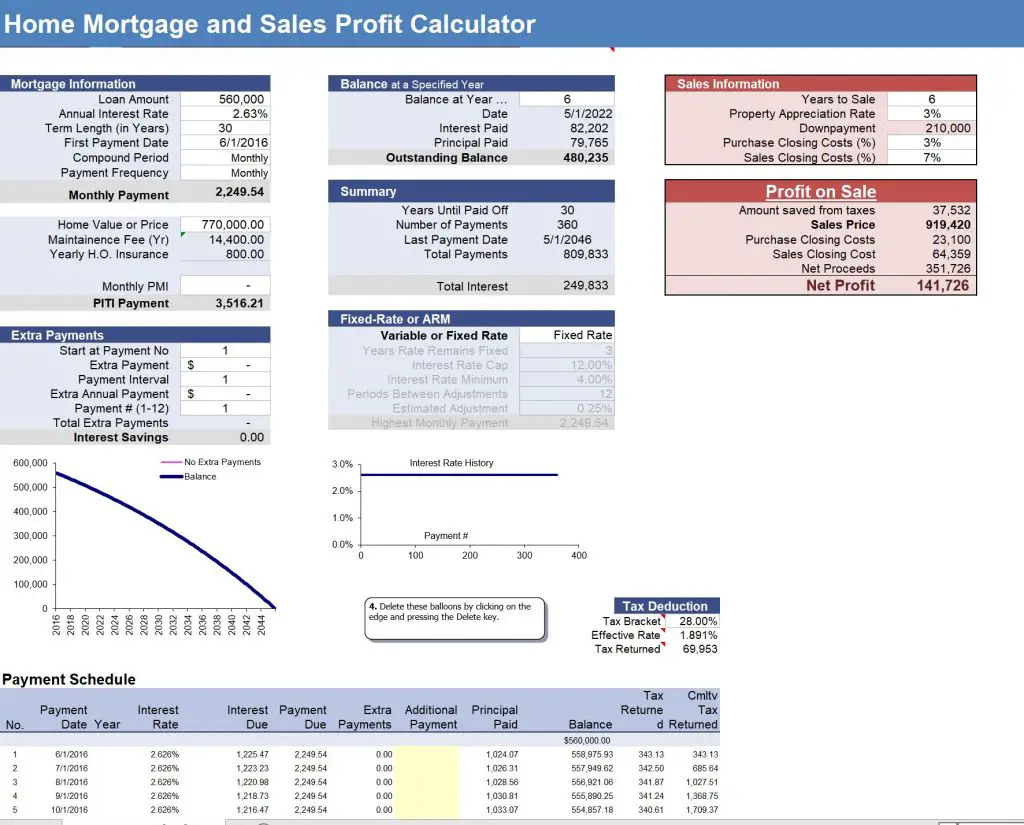
It also provides a full amortization schedule so you can see exactly how much principal is left over after every payment. You can see from the screenshot below that it gives an amortization schedule for the full 30 years of the mortgage (Assuming it’s a 30y mortgage) and you can see the split between principal and interest paid.
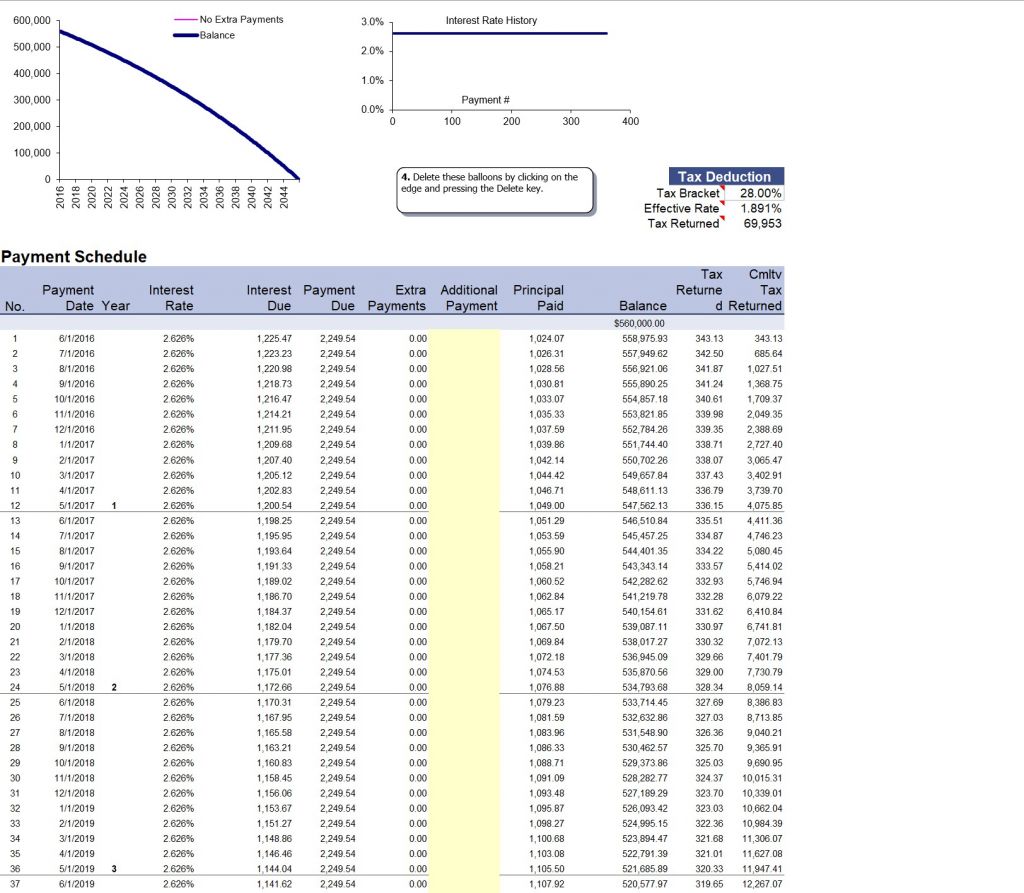
As you can see from this photo, the mortgage in the spreadsheet is $560,000 with an interest rate of 2.625% amortized over 30 years. You can see from the principal paid column, this value goes up after every payment which is the exact math for an amortization schedule. You always pay more interest at first and more principal later on in the mortgage. There is a breakeven point of around year 4 where your monthly principal paid outweighs your interest but this point will change depending on your interest rate (the higher the rate, the later your breakeven point will be).
In addition, this spreadsheets tracks how much interest you’ve paid at every month and even allows you to calculate how much tax you can expect to get back based on your tax bracket. Remember that mortgage interest is fully tax deductible!
How to calculate the profit on a sale of a home
There are countless spreadsheets and templates online to track a mortgage but I’ve found very few that also let you calculate the profit you would make when you sell your home/condo.
This spreadsheet has a table that also calculates your potential profit on a home sale based on criteria you give it. This includes things like closing costs, home appreciation rate, and principal paid.
Remember when you sell a home, you must pay the broker fees (normally), various transfer taxes, lawyers (dependent on your state), and other things that add up. Your home sale profit is never a simple calculation of your sale price – purchase price.
For the purpose of this spreadsheet, I structure my home sale profit calculator to be the following:
- Home Sale Price – Closing Costs (purchase and sales) – Remaining Principal Amount
- Purchase closing cost = A percentage that you manually set * Purchase price of home
- Sales closing cost = A percentage that you manually set * Sales price
How to use the Mortgage spreadsheet
This section will go into just how to populate this spreadsheet and get it to work for you. There is a lot going on in this spreadsheet so I’ll try to explain it slowly using the screenshot below:
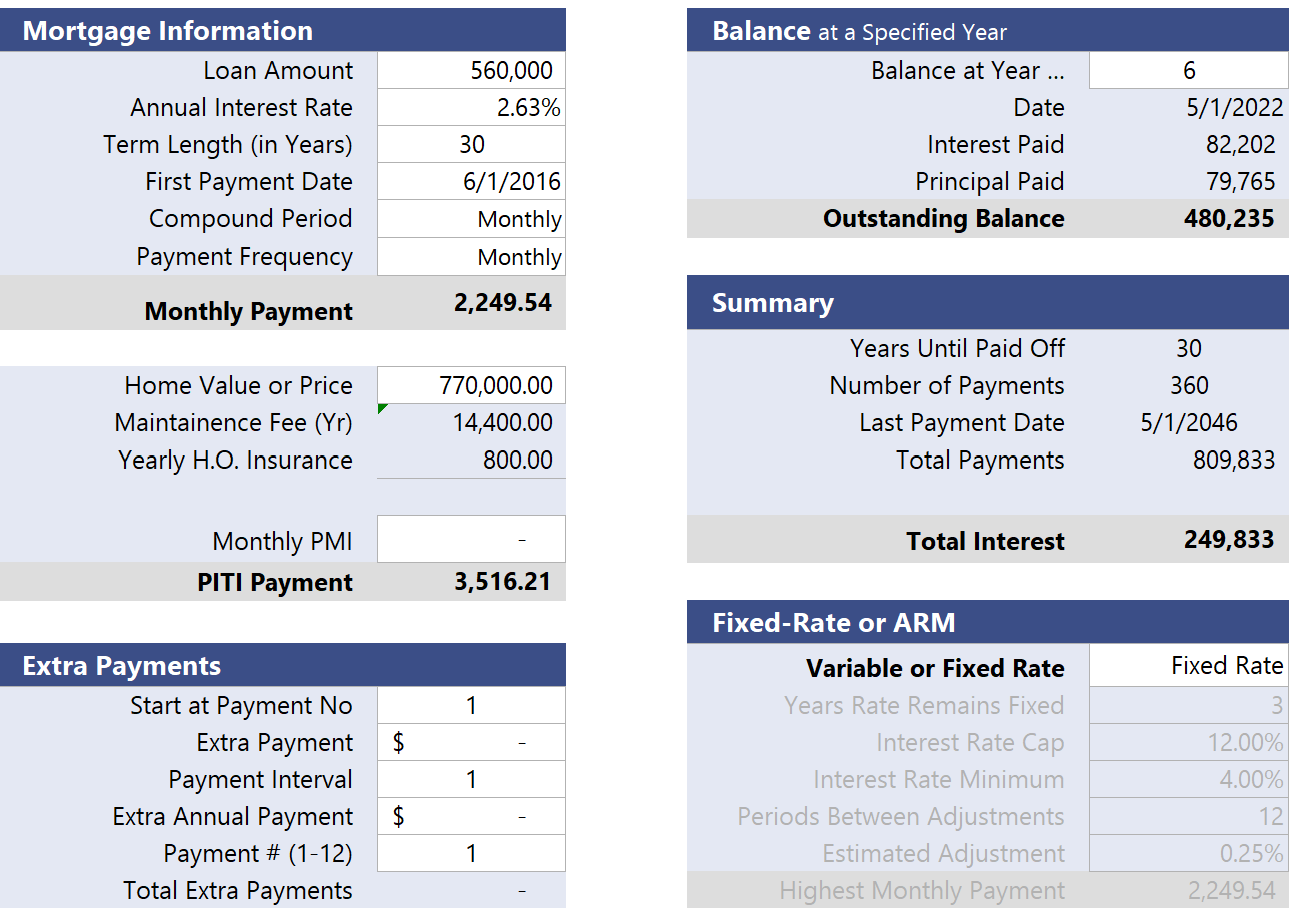
Mortgage Information
In the first table labeled Mortgage Information, you can input the basics. These include the following:
- Loan Amount: Self explanatory
- Annual Interest Rate: Self explanatory
- Term Length: Self Explanatory
- First Payment Date: This is when your mortgage starts. It’s not important in terms of calculating the actual payments but rather just a good way for you to track your specific mortgage
- Compound Period: Most mortgages are paid monthly so this should be left on monthly unless you have something else
- Payment Period: Similar as above, most mortgages are paid monthly
- Home Value or Price: Your purchase price
- Taxes and Common Charges: This is the combination of your property taxes and any common charges you might have. Common charges are more common in condo buildings for example.
- Yearly HO Insurance: Your home owner insurance amount.
Extra Payments
This section is for those that plan or want to see the effect of what prepayments look like. This is simply just paying your mortgage off early. This means you can make a one time extra payment to your mortgage or have a recurring monthly amount that you want to add.
Let’s say your mortgage payment is $2,000 every month. You want to pay an additional $200 every month to see what would happen. Simply add this number to the fields in this table and you can see how the figures in the summary table will change. Your “Last Payment Date” will be an earlier date.
In addition, you can always input an extra payment within the amortization schedule in the “Additional Payment” column shaded in yellow.
Balance Table
The next table labeled Balance is simply just a view of your mortgage at year x. You only need to change the first row for which year you want to see. In the screenshot above, I chose year 6. You can see that after six years, I’ve paid $82k in interest and $80k in principal.
The remaining principal is $480k.
Fixed Rate vs ARM
This table is for those that have an adjustable rate mortgage. While the most popular mortgage in the US is a 30y Fixed, many people opt to get an adjustable rate mortgage, or ARM for short. ARMs offer an introductory teaser rate that is lower than a comparable 30y fixed mortgage. Generally this is for 5y, 7y, or 10y of which you should expect differing rates.
At the end of this introductory period, the remaining life of your mortgage is paid at a floating rate that generally tracks the 1y Libor rate + an additional spread the bank sets. This rate will be usually fixed every 6 or 12 months.
For example, a 7/1 ARM means your mortgage rate is fixed for the first 7 years, and then it “adjusts” every year for the remaining 23 years of the mortgage. Let’s say your introductory rate is 3%. This means you will pay 3% for 7 years. After year 7, the mortgage rate will adjust to a floating rate. Let’s assume the 1y LIBOR is at 2% and your bank’s spread is set at 2%. This means that your new rate will be 2% + 2% = 4%. For year 8, your mortgage rate will be 4% and you can repeat this process at the beginning of year 9, 10, 11 etc.
Home Profit Calculator
This section focuses on the profit calculator portion of the spreadsheet. From the table below, make sure to only edit the cells in white as the shaded cells are formula driven.
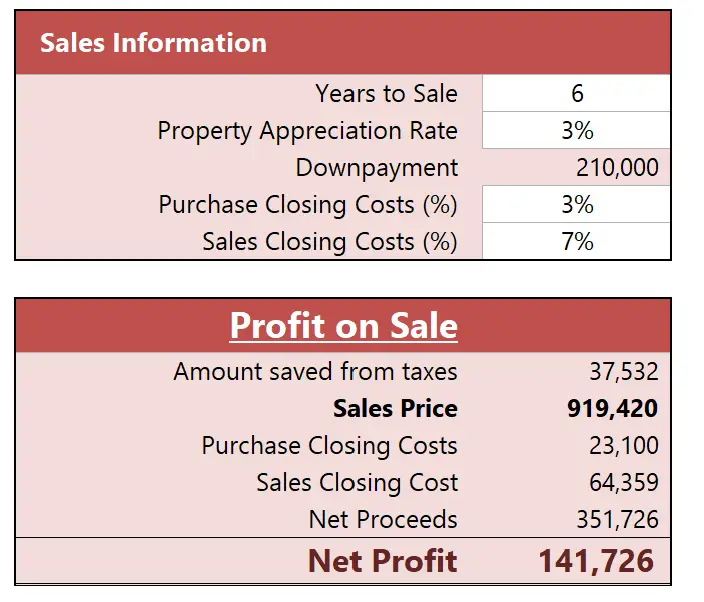
- Years to sale: Self explanatory
- Property Appreciation Rate: This is a the rate at which your property will appreciate. This is manually set because you have no idea what the price of your home sale will be in the future. This is simply an educated guess based on historical returns.
- Purchase Closing Costs: How much you spent when you first purchased the home. Things like transfer taxes, lawyer fees, lien fees etc.
- Sales Closing Costs: How much you pay when you sell your home. These are things like transfer taxes, broker fees (normally 5-6%), a flip tax (if you are in a New York Coop), and more.
After you’ve input the right numbers for your home, the second table will show you all your profit. If you don’t know what the property appreciation rate should be, you can simply just override the “Sales Price” row with a property price of your choosing to see what the net profit would be.
As you can see from the table above, If I sold the home for $919k, I would have a net proceeds of around $351k. This is simply the sales price less the remaining mortgage amount less all the transaction costs.
Finally, the net profit row is simply the net proceeds less your down payment. The down payment of course is not a part of your actual profit since you had to spend this money up front and in cash.
The Mortgage Spreadsheet
For the purpose of this spreadsheet, I made it in Microsoft Excel. I normally use Google Sheets for my spreadsheets but this mortgage spreadsheet has been in my repertoire for quite some time and I’ve had no success porting it over to Google Finance.
Download mortgage and home profit spreadsheet
The spreadsheet is simple, yet effective. Just make sure you update it on a regular basis. I would recommend spending 5-10 minutes updating the spreadsheet once a month with your figures. I don’t always do the exact amount for different expenses because it takes a lot of time but that is also up to you. You can use this spreadsheet if you’re a single person as well as if you’re a couple (just add everything up!).
Keep in mind that this spreadsheet is also what I use to track my own mortgage. I will be making updates live and will add additional features to this spreadsheet as time goes on so make sure to check in for updates!
Download Stock Trading Spreadsheet!
The spreadsheet is in Microsoft Excel and I’ve uploaded it online to Office 365 for you to all use and download.
Trading Options next
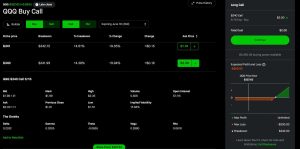
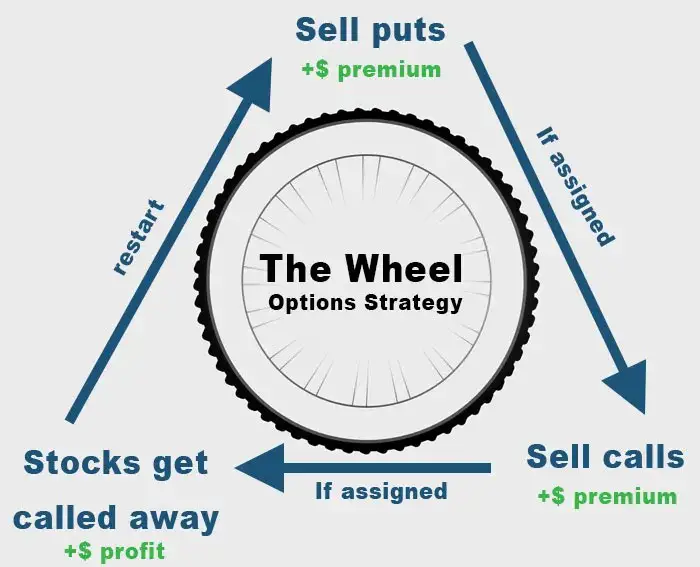
Selling covered calls and cash secured puts (or the options wheel) is a great way to generate “relatively” safe income during retirement. The option wheel is something I use to generate consistent and relatively stable income.
It is one of the primary methods I use to generate a little extra income during retirement. While not necessary for me since the Trinity principle already states I have enough of a portfolio to live off the interest, I am okay with a little more risk and find selling options to be quite interesting.
Make sure to also read my options spreadsheet post to better understand these strategies!