

Spreadsheets are life and Google Finance is the ultimate tool to create a beautiful spreadsheet for stocks, FX, and more. I am a fan of using them for everything. I religiously use a spreadsheet to track my net worth and expenses as well as when I collect credit cards for their lucrative rewards.
I’ve always traded stocks and invested my money over the long term as a way to pursue the FIRE (FInancial Independence Retire Early) lifestyle. I couldn’t find many good spreadsheet options to track the list of all my stock positions which turned out to be ever increasing.
I reached Financial Independence in 2020 which was quite the milestone for me. In the last year, I’ve traveled the world for a year and my net worth actually increased. Option selling has helped me manage my expenses and income during early retirement.
- Trading options is all a part of my net worth building regimen. I use this spreadsheet to track net worth and expenses.
- If you’re more advanced and want to trade options, I’ve also created this spreadsheet to track options trading
- Also, check out my travel itinerary planning spreadsheet which is perfect for organizing and planning your trip!
- My spreadsheet to track my stock positions using the Google Finance function.
Why use Google Finance in A Spreadsheet?
If you’re planning to trade stocks or track your portfolio, Google Finance offers powerful formulas and features to help you track your Your brokerage in 2021 and beyond will do more than a sufficient job of tracking your investments. I use Chase and Robinhood as my main brokerages and I know they display my positions in an easily digestible format.
The GOOGLEFINANCE function allows you to import real-time financial and currency market data from Google’s own database straight into Google Sheets. You can also use it to create historical data tables of stock prices.
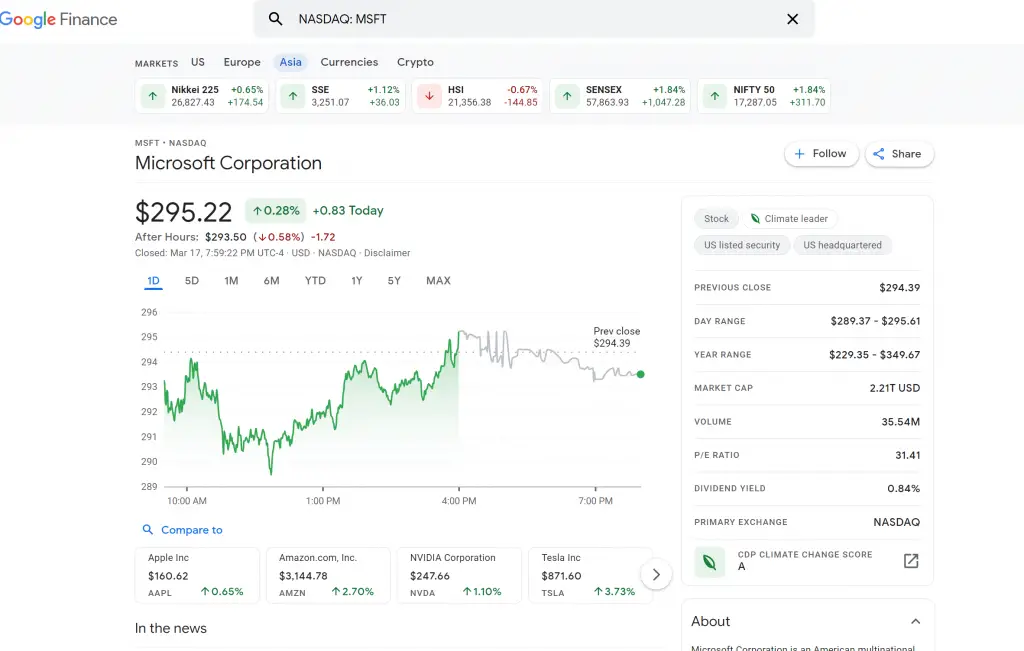
This function imports data from the Google Finance web application, which provides daily stock prices, news from the currency and financial markets, and other information on market trends. Google Finance can be accessed from the Google menu like all other Google applications, or simply by searching for a stock on Google, which will bring up the Google Finance information relating to that stock.
However, I firmly believe you just can’t substitute for a nice spreadsheet which puts all the information that I need in one window that I can easily access and analyze.
How I use Google Finance
Google Finance can be used for a variety of different spreadsheets and financial record keeping. I use Google Finance mostly for my stock portfolio spreadsheet where I keep track of all my stocks. Of course your brokerage already offers a very organized view of your portfolio but I am just more comfortable with a spreadsheet.
I like keeping a Google Sheets that I can access from everywhere that will have information on all my stocks, as well as basic stock financials like Market Cap, EPS, P/E, Earnings Date etc. in one concise look. Often times, I find myself looking through my brokerage and having to open a separate tab to get the information about the stocks. This just saves me a few clicks.
Google Finance Attributes
To better understand the Google Finance function, let’s go over all the syntaxes that are available for use. The below is the formula with the available syntax in Google Sheets.
Formula: =GOOGLEFINANCE(ticker, [attribute], [start_date], [end_date|num_days], [interval])
| Attribute | Description |
|---|---|
| “price” | Stock price. In real-time but with a delay of up to 20 minutes. |
| “priceopen” | Opening price (price at market open). |
| “high” | High price of the current day. |
| “low” | Low price of the current day. |
| “volume” | The trading volume of the current day. |
| “marketcap” | The market capitalization of the stock. |
| “tradetime” | The time of the last trade of the stock. |
| “datadelay” | The delay time for the real-time data. |
| “volumeavg” | The average daily trading volume. |
| “pe” | Price-to-earnings ratio |
| “eps” | Earnings per share |
| “high52” | The highest price in the last 52 weeks. |
| “low52” | The lowest price in the last 52 weeks. |
| “change” | The stock price change since the end of yesterday’s trading. |
| “beta” | The beta value |
| “changepct” | The percentage change in price since the end of yesterday’s trading. |
| “closeyest” | Yesterday’s closing price. |
| “shares” | The number of shares outstanding. |
| “currency” | The currency that the stock is priced in. |
| Historical attribute | Description |
|---|---|
| “open” | Price at market open. |
| “close” | Price at market close. |
| “high” | The high price during the specified time period. |
| “low” | The low price during the specified time period. |
| “volume” | The volume during the specified time period. |
| “all” | Returns all of the above. |
So you can see that you can get information about stocks, FX, and various other asset classes at the tip of your fingers. The google finance function is an incredibly powerful function with limitless customization. I use this formula almost exclusively on my Stock trading spreadsheet which I will use as an example below of how to implement the Google Finance function.
Examples of using Google Finance function
Getting the price of a stock
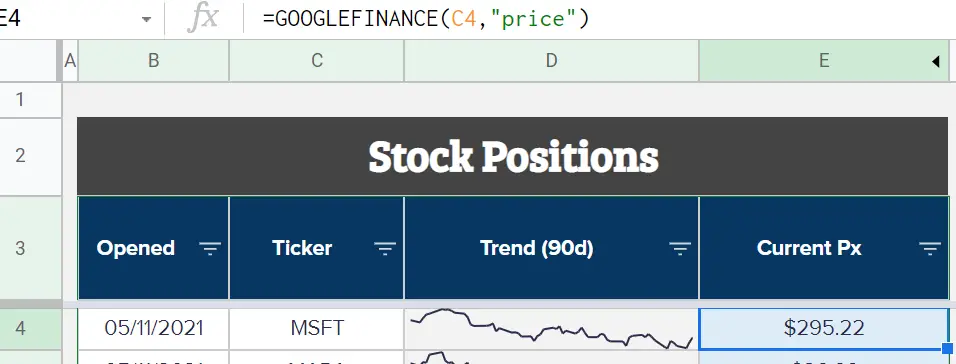
The easiest and most simple function of the Google Finance function is “price”. This simply returns the price of the stock at the most recent point.
Syntax: =GOOGLEFINANCE(“Stockticker”,“price”)
If the markets are closed, this formula will return the most recent closing price of the previous market day. If it’s during market hours, this formula will constantly update and you can manually refresh if you like.
In the below example, I used the stock ticker for Microsoft stock (MSFT) and you can see the current price of the stock. If you’re making a spreadsheet of multiple stocks, then it makes sense to reference the cell with the stock tickers on your list which is what I’ve done here.
=Googlefinance(“MSFT”,”price”)
Obtaining Historical stock information
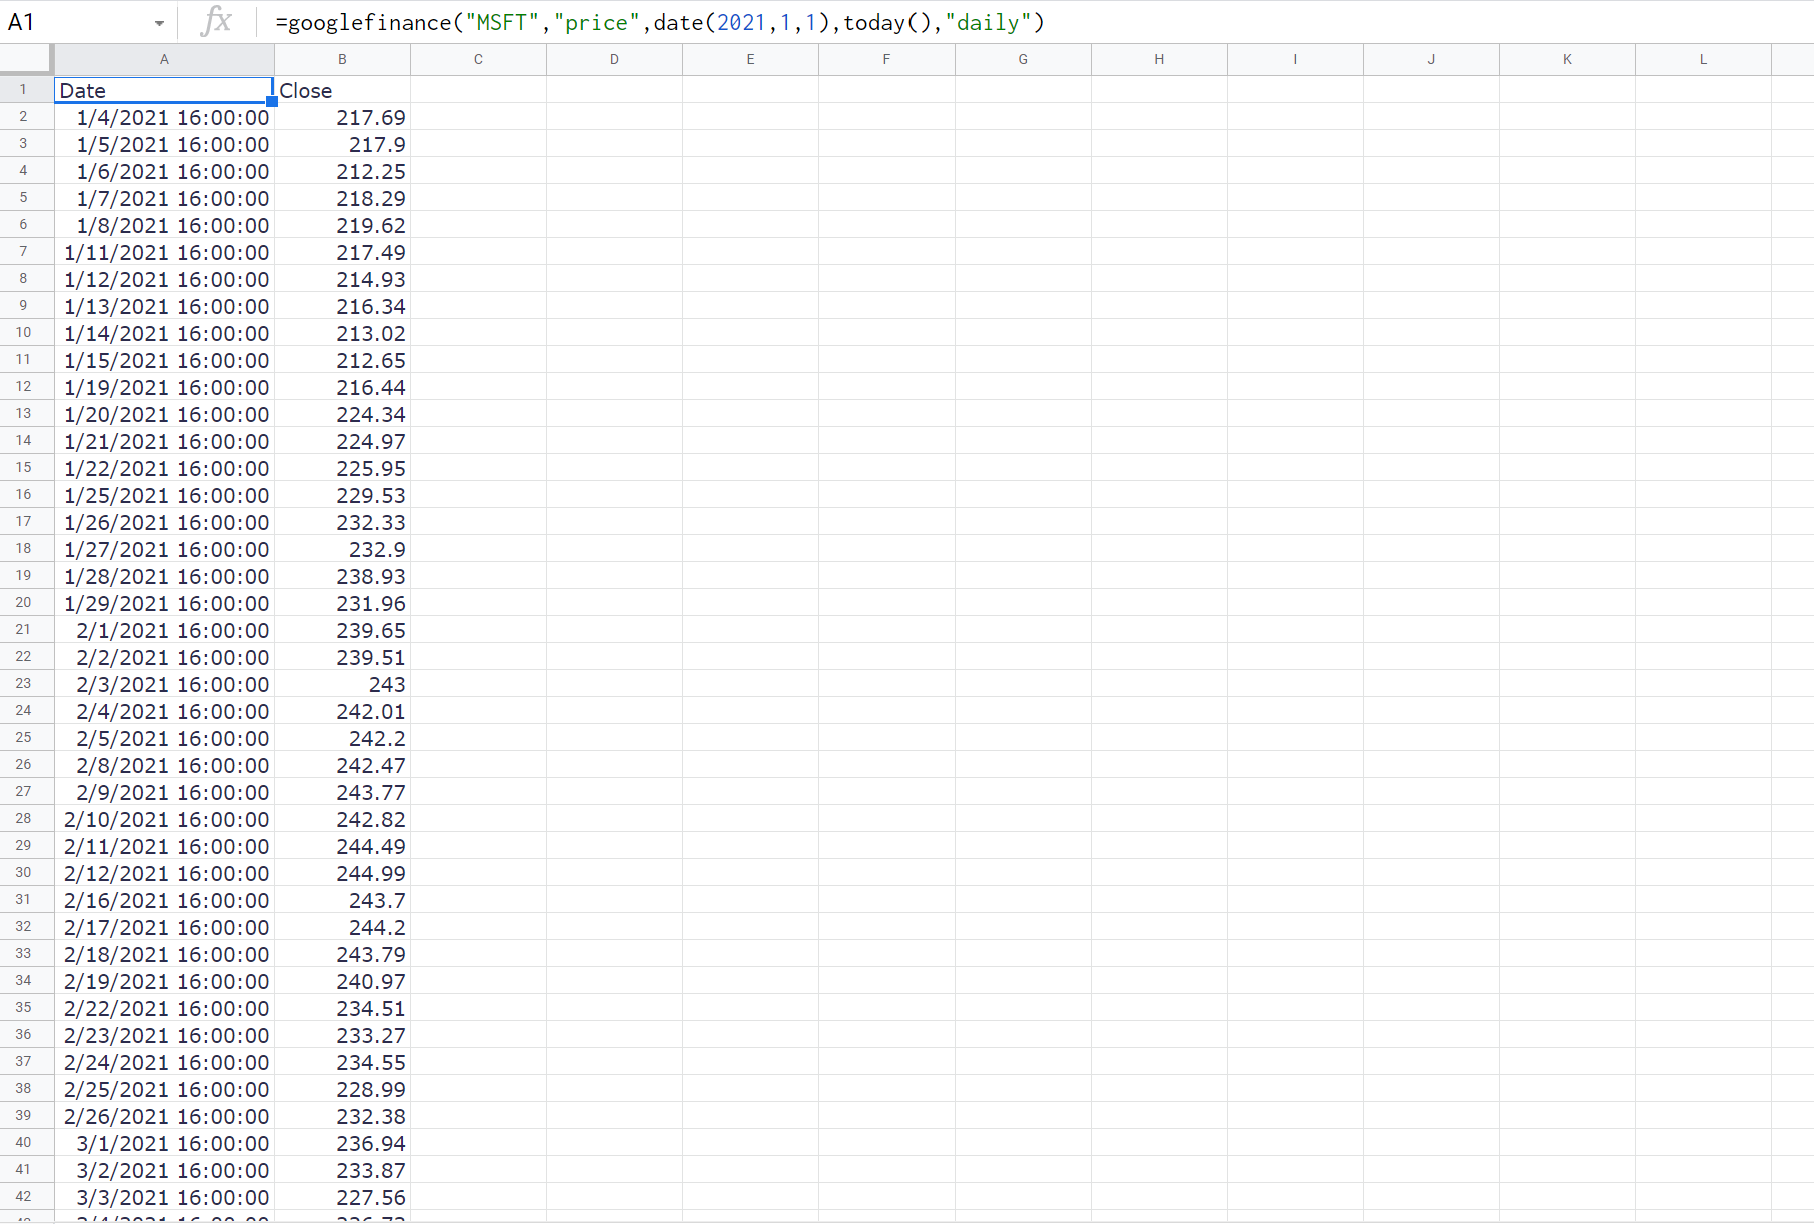
If you want to obtain the historical data of a stock price, Google Finance is your baby. The syntax is straight forward:
Syntax: GOOGLEFINANCE(ticker, [attribute], [start_date], [end_date], [interval])
This is pretty straight forward as it’s the same formula as above but you select the date interval you want your history to be. You set your interval to daily, weekly, monthly depending on the kind of analysis you need.
For my example, I used Microsoft stock again from the beginning of 2021 to the most recent date by using the today() function. Note that if you use today(), this table of historical data will automatically update the following days with new closing prices.
=googlefinance(“MSFT”,“price”,date(2021,1,1),today(),“daily”)
Obtaining Stock fundamentals
Google Finance offers an array of different fundamental analysis for stocks. This includes things like Market Cap, daily volume, 52w high/lows, EPS, etc.
If you want to call on one of these functions, you can simply follow the syntax from the table of Google Finance functions above. For example, if you want the market cap of a stock, instead of using “price”, you can simply replace this with “marketcap”.
Formula: =googlefinance(“MSFT”,”marketcap”)
The corresponding picture will look like this. The market cap will always be in dollars so for the purposes of making the number a bit more digestible, I divided it by 1,000.
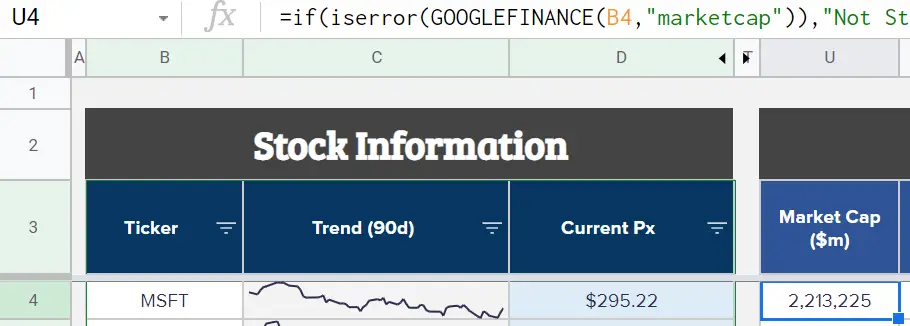
If you want more stock fundamentals on your spreadsheet, simply create new columns and add in all the different features you want. I’ve added numerous features like the below.
Using Google Finance for FX currency exchange
Google Finance can also be used to obtain currency information. All the major currency pairs that you can find on Google’s Finance website can also be used with the Google Finance spreadsheet functions. I use these exchange rates for my expense splitting spreadsheet incase you have a trip with multiple currencies.
The syntax is relatively straight forward and similar to the above functions but instead of putting in a stock ticker, you’ll want to put in a currency pair by using the below syntax:
Syntax: =googlefinance(“CURRENCY:YOURCURRENCYPAIR”,”close”)
This is slightly different than a stock ticker because you’ll need to using the text “CURRENCY:” before your actual currency pair. In addition, you’ll use “close” instead of the “price”.
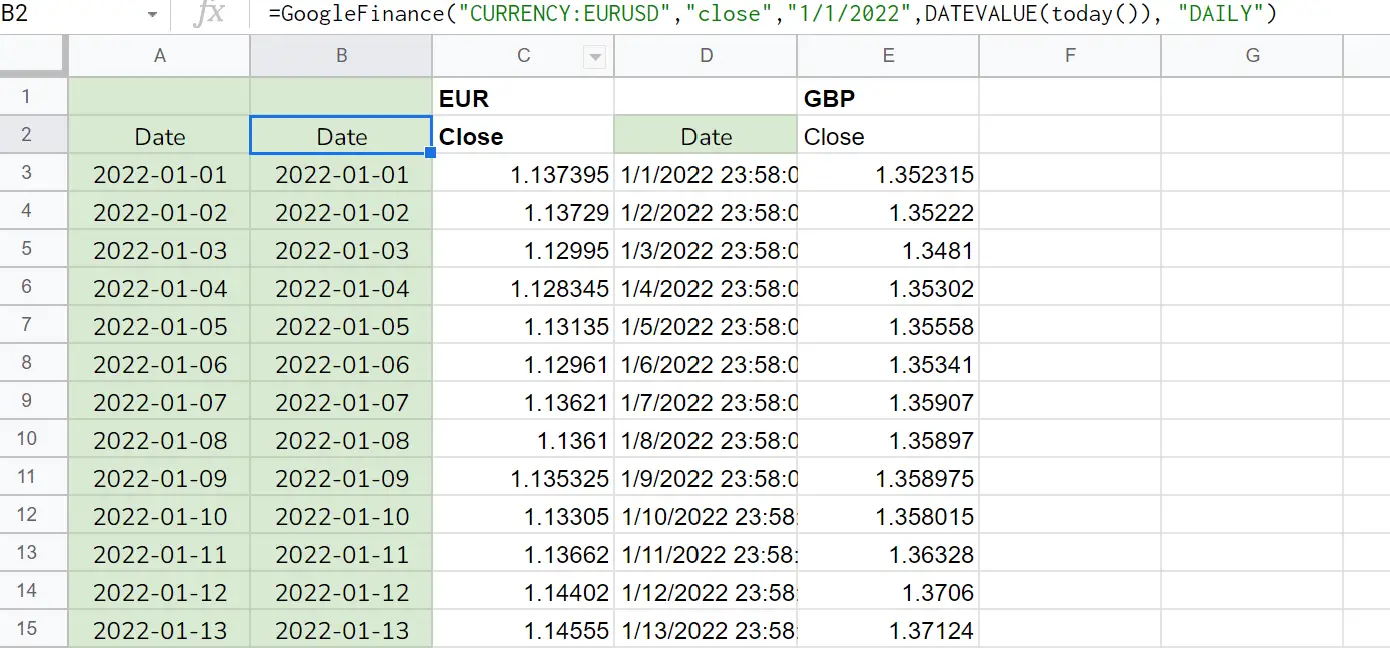
Below is an example of using the Google finance function to obtain a history of the Euro to US Dollar exchange rate:
=GoogleFinance(“CURRENCY:EURUSD”,“close”,“1/1/2022”,DATEVALUE(today()), “DAILY”)
Using Yahoo Finance to provide even more information
Google Finance is great for those looking to import important stock information into a spreadsheet. However, Google Finance has limited functionality in its formulas. There are fundamentals missing from Google Finance like dividends, earnings dates etc.
I find that Yahoo Finance provides more information on their website. If you want to import this information onto your spreadsheet, this is no longer a Googlefinance function on Google Sheets but rather you’ll need to reference it using the importhtml function on Google Sheets. Let’s say I want to grab dividend information including dividend yield, ex-dividend date, as well as the next earnings date. You can see all of these values on Yahoo Finance’s website.
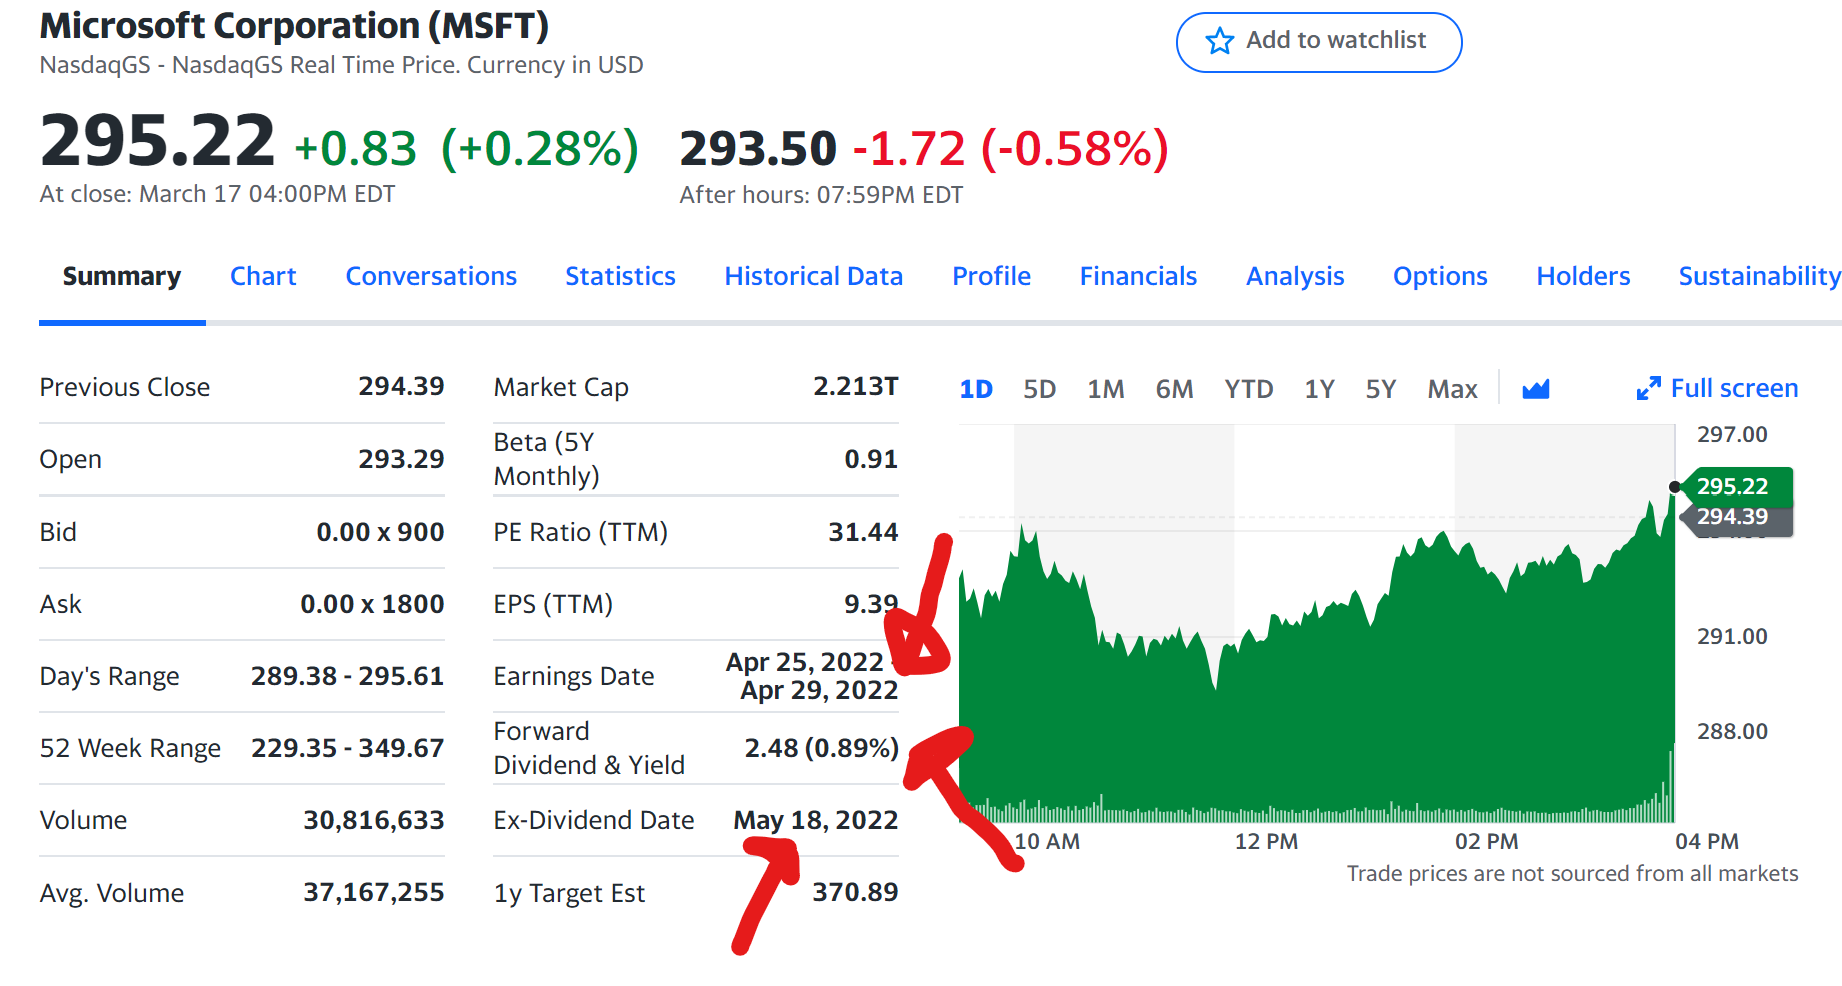
I want the information from the red arrows. In order to do this, you’ll essentially have to use an index and import html function to reference the webpage of Yahoo Finance’s MSFT ticker page, and then use positioning to grab the data you want.
All of this will make sense with the example:
Example: =SPLIT(INDEX(IMPORTHTML(concatenate(“https://finance.yahoo.com/quote/”,C7),“table”,2),5,2)

Stock Trading Spreadsheet Using Google Finance
I think a lot of old school traders keep a detailed journal for trading. I wouldn’t say I am old school because I’m not that experienced of a trader at all. However, I have been using a few strategies to generate consistent income while I was working and after I retired early.
For the purpose of this spreadsheet, I used mostly almost entirely Google Finance functions to populate stock information, pricing, financials etc. You can also use the Google API to customize and add fields of your own to your liking. I also use an importXML command to obtain information from Yahoo Finance on dividends and earnings related data.
Download stock spreadsheet using Google Finance
The spreadsheet is simple, yet effective. Just make sure you update it on a regular basis. I would recommend spending 5-10 minutes updating the spreadsheet once a month with your figures. I don’t always do the exact amount for different expenses because it takes a lot of time but that is also up to you. You can use this spreadsheet if you’re a single person as well as if you’re a couple (just add everything up!).
Keep in mind that this spreadsheet is also what I use to track my own expenses. I will be making updates live and will add additional features to this spreadsheet as time goes on so make sure to check in for updates!
Download Stock Trading Spreadsheet
The spreadsheet is in Google Sheets because if I update it in the future, it will be easy to access from anywhere with an internet connection. I prefer this to Microsoft Excel. It’s easy to download it and use with Microsoft Excel as well.
To download offline, click the red button above, then click file > download as > Microsoft Excel
To use it with your own Google profile, just click file > make a copy
[vc_row][vc_column][mvc_infobox info_style=”mega_info_box_2″ info_opt=”show_icon” icon_size=”20″ icon_radius=”5px” title_color=”#000000″ font_icon=”fas fa-exclamation” icon_color=”#0a0a0a” hoverclr=”#0a0a0a” icon_bg=”#e5e5e5″ hoverbg=”#c9c9c9″ caption_url=”” info_title=”Constantly Changing” title_size=”25″]Note that this spreadsheet is constantly changing. This spreadsheet may look different depending on when you’re reaching this post![/mvc_infobox][/vc_column][/vc_row]
Using the Stock Portfolio Spreadsheet
As someone that works with spreadsheets regularly, I’ve included some functionality like conditional formatting and formulas that an Excel novice might not understand. I will explain everything necessary for those wanting to get the full use out of the stock portfolio tracker spreadsheet.
For the most part, anyone with any excel experience should just follow my spreadsheet and populate accordingly. Do not touch cells with formulas because everything is intricately linked. All cells that you should update have been color coded with gray cells.
The shaded cells
All shaded cells on this spreadsheet are formulas. They are not mandatory but I find them helpful for my own trading purposes. You may or may not depending on your style.
Of course, you can modify them or add your own formulas to your use.
- % of Total Portfolio: Simply the percentage your one stock position makes up of the entire portfolio. It should always sum up to 100% at the bottom row.
- % off 52 week high: This tracks how close your stock is to its 52 week high price.
- Days Held: How long your position has been on the books. This is more useful for trading options but I find it for simple stocks, it is good to keep track for tax purposes if you decide to sell.
Adding new trades
The spreadsheet is not super fancy unfortunately. If you are adding a new trade, simply copy and paste the previous row and update the ticker and option information accordingly.
Let the formulas auto-populate accordingly and it should look find otherwise.
Close the trades and keep track of your realized P&L
When selling stocks, you’ll want to record your closing date and your closing price. This way you can track the profit or loss you’ve realized.
This will generate tax events so keep in mind it will be long term gains tax rate if the position was held for over 1 year. Otherwise, it will be taxed as regular income if it was held under a year.
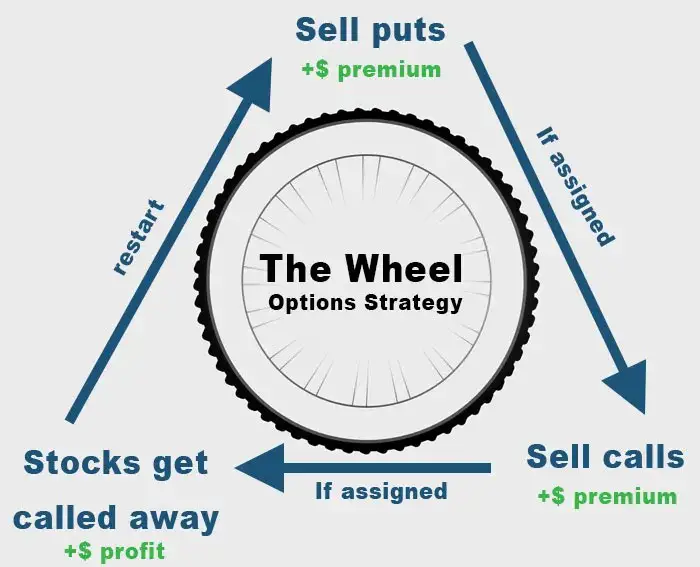
Trading Options next
Selling covered calls and cash secured puts (or the options wheel) is a great way to generate “relatively” safe income during retirement. The option wheel is something I use to generate consistent and relatively stable income.
It is one of the primary methods I use to generate a little extra income during retirement. While not necessary for me since the Trinity principle already states I have enough of a portfolio to live off the interest, I am okay with a little more risk and find selling options to be quite interesting.
Make sure to also read my options spreadsheet post to better understand these strategies!


very nice blog this will be helpful for me, thank you guys for posting this kind of information you can get more information about accounting and bookkeeping at Account-Ease
Thanks for the useful info Johnny. I’ve recently moved to Sheets (from Excel) and no longer have Bloomberg API access, so the GoogleFinance links are a godsend.
Just a small matter of re-wiring all those manual entries…
Hi Ken glad you liked it! I think Google finance is just great for the simple things. Of course can’t replace Bloomberg api but don’t think the average person will ever need that hah